The world we live in with COVID-19 has introduced all of us to business intelligence, business analytics, data analytics. A topic with many names.
Individually and as business decision makers we ask ourselves and others:
what happened
why did it happen
what can I do now
what will happen next
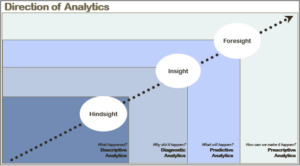
Here is a picture I have shared hundreds of times with many audiences.

There are lots of comments that can be made about this picture:
…. we are almost always looking backwards – Hindsight
…. we frequently ask why it happened – Insight
…. we wonder what can we do now – Foresight
Other comments could be:
…. we’re stuck in the lower left – Descriptive
…. wish I knew why it happened – Diagnostic
…. knowing what will happen would be wonderful – Predictive
…. making it happen could be really good – Prescriptive
I first saw this picture in 2015 at a seminar. The presenter said “ we are all in the lower left “. Certainly many companies have made great strides up and to the right. But, if a picture is worth 1000 words – most of us still have a long way to go.
Back to COVID-19 here is a very interactive dashboard by John Hopkins University
https://coronavirus.jhu.edu/map.html
